ESG AND SOCIAL
Manage your social and ESG data
Analyze and leverage your HR and ESG data to turn your reports into drivers of societal performance.
4.9 / 5

ESG that creates value, not complexity
Save time on analysis
Your social and ESG data is automatically integrated and ready to be leveraged.
More value for your clients
Clarify your HR and ESG challenges and turn them into strategic recommendations
Compliance ensured, lasting impact
Anticipate requirements and showcase your clients’ commitment to their stakeholders
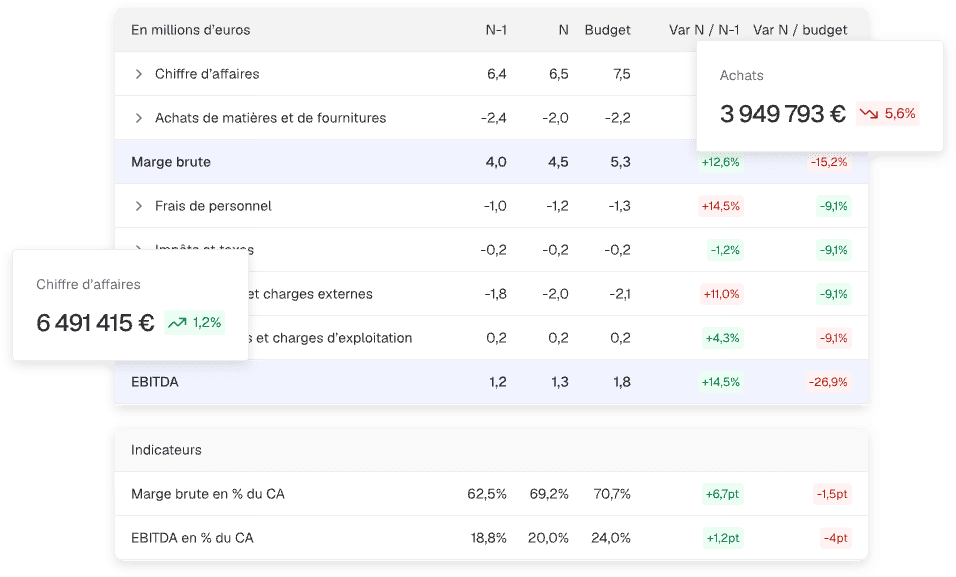
360° reporting including social and ESG
Integrated ESG indicators
Measure your environmental, social and governance impact with standardized indicators: carbon footprint via the ADEME Base Carbone®, training expenses, customer/supplier payment terms, etc.
Social dashboard
Import your DSN files in just a few clicks or via API, track changes in your workforce, payroll costs, absenteeism, or compensation, and instantly visualize your HR KPIs.
Unified finance + social + ESG data
Cross-reference your HR, financial and ESG indicators for a global view of your business and better decision-making.
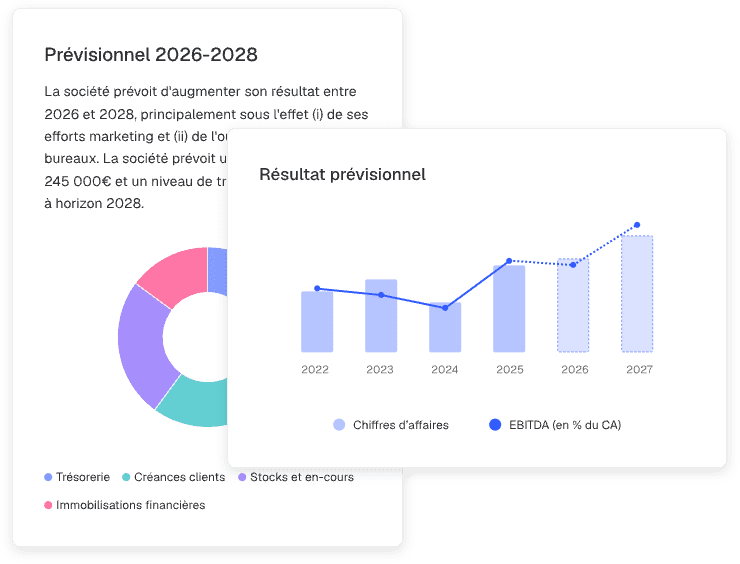
Clear visualization and instant sharing
Create impactful dashboards, share them with your clients or teams, and make your reporting more comprehensive and easier to understand.
They use Finthesis’ social and ESG module
Reviews
“Understanding these challenges means meeting the expectations of employees, clients and investors while reducing environmental impact. With Finthesis, we have a simple solution to help small and medium-sized businesses measure their impact and take action.”

Your 360° reporting in 3 steps
Step 1
Data connection / import
Connect your payroll software via API or import your DSN from your usual tools, with no manual data entry.
Step 2
Processing and structuring
Access your dynamic HR and ESG dashboards. Filter, compare, interpret. Everything is already calculated!
Step 3
Export, sharing, distribution
Export or share your 360° reports in one click, and support your advisory engagements with reliable and visual data.
Frequently asked questions
What are ESG indicators used for?
ESG indicators help measure your company’s non-financial performance.
Beyond reporting, ESG indicators become a strategic management tool: they help you identify improvement levers, track your CSR objectives and promote your strategy to your partners.
- They help to:
- Raise team awareness of sustainable development issues,
- Anticipate future regulatory requirements,
- Highlight your commitments to stakeholders.
Beyond reporting, ESG indicators become a strategic management tool: they help you identify improvement levers, track your CSR objectives and promote your strategy to your partners.
Which ESG indicators can I analyze with Finthesis?
With Finthesis, you can track three main categories:
You cannot add additional indicators directly, but you can suggest new ones via our participatory roadmap.
- Environment: company carbon footprint, energy consumption, etc.
- Social: workforce distribution, absence rate, turnover, training budget…
- Governance: payment terms, donations, compliance with internal commitments.
You cannot add additional indicators directly, but you can suggest new ones via our participatory roadmap.
Which data does Finthesis use to calculate ESG indicators?
Finthesis uses:
For carbon footprint calculations, accounting amounts are converted into tCO2e using a mapping table. Each account is associated with an expense category and a carbon emission factor. The methodology, categories and carbon equivalences are available directly in Finthesis’ ESG module.
- Your accounting and social data,
- Data from the ADEME Carbon Footprint Database
For carbon footprint calculations, accounting amounts are converted into tCO2e using a mapping table. Each account is associated with an expense category and a carbon emission factor. The methodology, categories and carbon equivalences are available directly in Finthesis’ ESG module.
Can I extract a complete and customizable CSR report?
Yes! From the CSR module, you can:
In addition, thanks to consolidated projects, you can group data from multiple companies to obtain ESG indicators at the group level.
- Select the indicators to include or hide,
- Choose the fiscal year to analyze for each visual,
- Export a report by defining which tabs to include (Environment, Social, Governance),
- Add a cover image, an end image and your logos.
In addition, thanks to consolidated projects, you can group data from multiple companies to obtain ESG indicators at the group level.
Can I connect Finthesis to my payroll software?
Yes! Finthesis connects via API with your payroll software. See the full list on our Integrations page.
Which data can I analyze in the social module?
The social module offers several types of analyses:
- Status for a specific month: age pyramid, gender or seniority distribution, number of FTEs/ETHs, etc.
- Trends over a period: payroll, paid hours, number of FTEs, turnover…
- Employee listings: compare data over a selected period, filter by position, contract type or analytical category.
- Configuration: create analytical categories, assign employees, define their remote work rate.
- By establishment: select establishments to analyze to refine your monitoring and reports.

Ready to leverage your data?
Get your first insights in seconds
You haven't seen everything yet
Reporting
Create your financial analyses and benchmarks in no time, without manual formulas, ready to share.
Discover
Forecasts
Model your scenarios and adjust your assumptions for simple, fast, and perfectly structured forecasts.
Discover

Dashboards
Turn your raw data into clear, visual analyses ready to be shared in seconds.
Discover